Strange patterns in the Species Interaction Factor

questions concerning analysis/theory using program PRESENCE

Strange patterns in the Species Interaction Factor

Postby Sunday » Wed Apr 17, 2013 6:17 pm

I am analyzing co-occurrence patterns in Pacific and Yellow-billed Loons using the multi-season, multi-species model presented in Richmond et al. (2010). Model selection results revealed that the two species generally co-occur (psiBA) on large lakes and lakes with convoluted shorelines (but lake size x shoreline model not as strongly supported). I plotted the Species Interaction Factor (SIF) for each site vs each covariate and found that SIF generally increased with these covariates as expected. However,some strange patterns emerged including a line of points at the SIF value of 1 (see images below).

Image

Image

I have attempted an explanation in my draft manuscript:
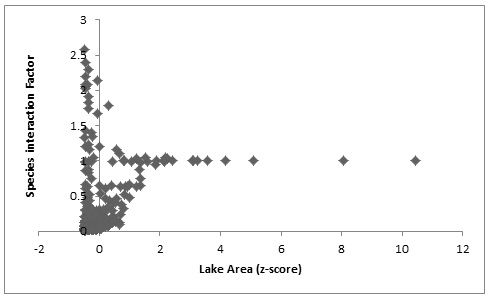
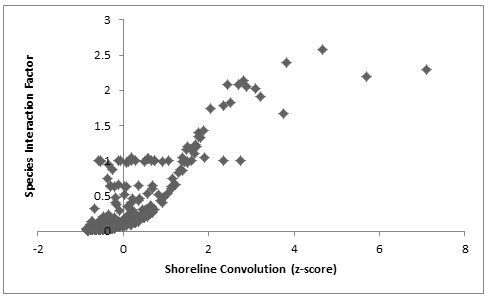
"Interestingly, Yellow-billed and Pacific Loons can coexist on the same lake in cases when the lakes are large or have convoluted shorelines. This was demonstrated by an increase in the probability of co-occurrence with Shoreline and Area covariates. As well, the SIF showed a positive relationship with Shoreline and Area. High values of Area led to SIF of 1 suggesting that on these lakes, the two species are randomly co-occurring (competition not affecting occupancy). At high values of Shoreline SIF > 1 suggesting there is aggregation on these lakes, likely due to high habitat quality (i.e., lakes with high Area and Shoreline values have more shoreline nesting habitat and larger lakes likely also have higher availability of fish prey). "

I was hoping to see if anyone had any insights into these patterns in the SIF values.
Sunday
 
Posts: 10
Joined: Thu Jul 19, 2012 9:32 pm

Re: Strange patterns in the Species Interaction Factor

Postby darryl » Wed Apr 17, 2013 6:36 pm

The SIF can get 'squeezed' to 1 (depending on exactly how it's defined) when the probabilites of occurrence for one of the species gets close to 1. Currently I recommend the SIF be defined as an odds ratio rather than the ratio of probabilities. Or you can estimate and model the odds ratio directly using the 'nu' parameterization for the 2 species models.
darryl
 
Posts: 498
Joined: Thu Jun 12, 2003 3:04 pm
Location: Dunedin, New Zealand

Re: Strange patterns in the Species Interaction Factor

Postby Sunday » Fri Apr 19, 2013 2:16 pm

Thank you for your response Darryl,

Given that the probability of detecting each species depends on the other species being present, I can calculate the odds ratio using equation 8.3 from your book given that I used the Richmond et al. parameterization?

Also, is the nu/rho parameterization the same as the parameterization from "Reparameterizing the Model" on p. 234-236 of your book?

Cheers!
Sunday
 
Posts: 10
Joined: Thu Jul 19, 2012 9:32 pm

Re: Strange patterns in the Species Interaction Factor

Postby darryl » Mon Apr 22, 2013 9:13 pm

Equation 8.3 is the apparent odds ratio when detection isn't accounted for, it's equation 8.1 you want to look at. Note that this can be simplified a bit if you define:
psi_A = Pr(sp A present) (irrespective of sp B beign present)
psi_Ba = Pr(sp B present given sp A absent)
psi_BA = Pr(sp B present given sp A present)

Then OR = {psi_BA/(1-psi_BA)} / {psi_Ba/(1-psi_Ba)} = nu

Further, there's a relationship with logistic regression (ignoring detection) as if we just used the presence or absence or sp A (call it X, = 1 or 0) as a covariate on the presence of sp B, eg.

logit(psi_B) = stuff + b*X,

then exp(b) = nu.

You can use this approach also for detection, and also colonization and extinction if you talking about multi-season data.
Darryl
darryl
 
Posts: 498
Joined: Thu Jun 12, 2003 3:04 pm
Location: Dunedin, New Zealand

Re: Strange patterns in the Species Interaction Factor

Postby Sunday » Sat Apr 27, 2013 1:29 pm

Thank you kindly Darryl! Your help is much appreciated.
Sunday
 
Posts: 10
Joined: Thu Jul 19, 2012 9:32 pm

Re: Strange patterns in the Species Interaction Factor

Postby spp » Mon May 27, 2013 7:35 am

Hi, Maybe this a stupid question but does anyone know how to calculate a SE for the OR as above?
I used the 2nd parameterization and have model averaged estimates of BA= 0.43 (SE 0.14) and Ba = 0.15 (SE 0.10), so believe the OR = 4.58. Any suggestions much appreciated.
spp
 
Posts: 1
Joined: Mon May 27, 2013 6:19 am

Re: Strange patterns in the Species Interaction Factor

Postby jhines » Mon May 27, 2013 7:56 am

You could use the delta method to obtain SE's of nu, or if you don't have covariates on the psi's, re-run the model in PRESENCE, selecting the 'nu-rho' parameterization.

Jim
jhines
 
Posts: 632
Joined: Fri May 16, 2003 9:24 am
Location: Laurel, MD, USA


Return to analysis help

Who is online

Users browsing this forum: Google [Bot] and 2 guests

cron